The Interaction tab allows you to understand the Talk Time for certain teams and individual team members. The Talk Time tab is an excellent way of comparing meeting performance among users. As an example, we can look at our top-performing sales reps and identify that their talk time consistently falls between 40% and 60%. Other reps can then begin to align with these reps' patterns and drive more revenue.
Reviewing talk times
- Navigate to the Conversation Insights icon in the left-hand navigation bar and select the Interaction tab.
- The home page of the Interaction tab will default to show the entire organization over the last 30 days.
- Once the appropriate filters are applied, you can begin using the breakdown to identify which meetings may need to be reviewed. Each dot indicates where that call falls on the spectrum. Those that either end outside of the recommended band may require additional review.
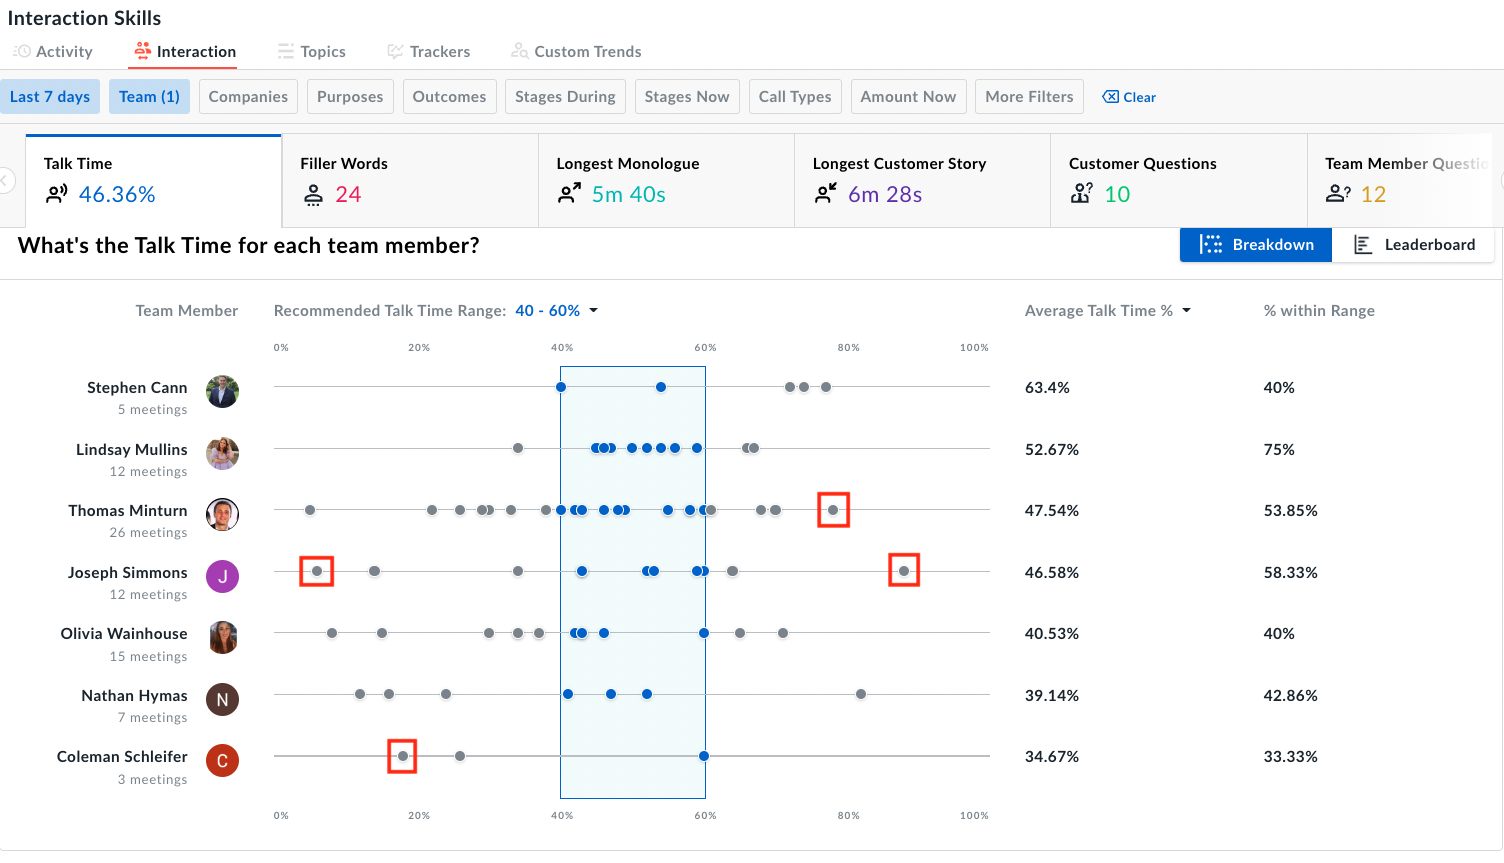
- Avoma allows you to hover over each of these points on the graph and jump directly into the meeting.
NOTE: The recommended 40-60% talk time is based on Avoma's findings. However, it's important to use additional filters to discover what talk time is most useful for your organization's needs.
Filler Words
Filler words can overshadow an otherwise great presentation. This feature allows Avoma users to quickly identify which filler words are driving the audience to distraction.
- Navigate to the Conversation Insights icon in the left-hand navigation bar and, select the Interaction tab, then choose Filler Words.
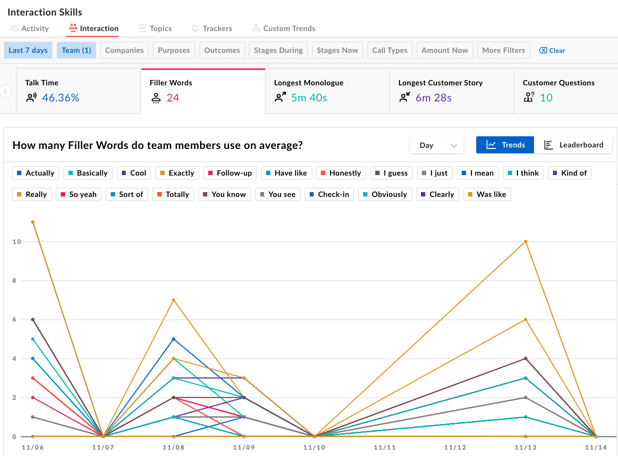
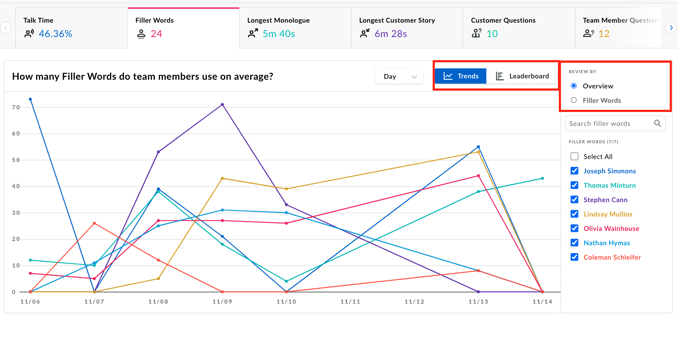
- You can use a variety of different filters to review an overview or specific filler words being used. There is also a leaderboard showing which team members are using the most filler words.
Longest Monologue and Longest Customer Story
Both these analytics located in the Interaction tab provide powerful insight into the dynamics of each meeting. For example, If we look at the longest monologue tab and notice a 10-minute monologue on a 30-minute call, then you may want to reevaluate the structure of the meeting. Conversely, we should be aware when customers begin running a presentation.
Customer Questions and Team Member Questions
These analytics are another great tool for understanding habits and techniques used by top performers. Quickly identify the range of questions needed to lead your prospects to a closed deal. The customer questions section can help to analyze which points of a presentation could use additional clarity.
If you have any additional questions, please reach out to our team at help@avoma.com.